Oh god, I’m going to talk about maths for a bit. Ignore me. You might find this interesting if you know what a derivative is and what it means.
This is a curiosity that my friend Anupam came up with. I’m not claiming any credit for noticing it but I thought I’d still share it with y’all. It only requires very rudimentary calculus, but it produces a result which, the more I think about it, the less intuitive it seems.
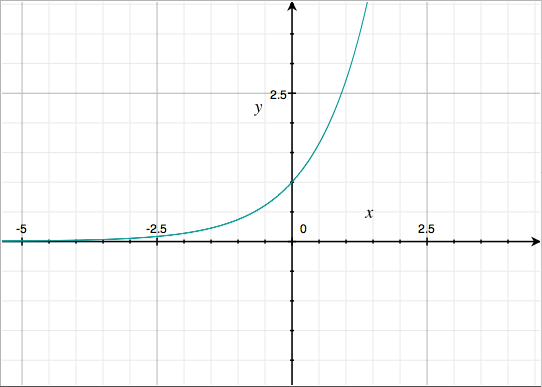
Let’s think about how to sketch the graph of . Well, we know what the graph of looks like:
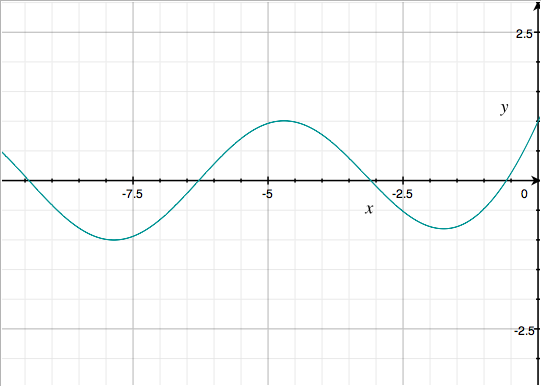
and we know that the graph of exists always between +1 and -1. So we can make a pretty good guess that for negative , where is very small (less than 1), the graph will look something like the graph for :
But what about for positive , where is now larger than , and is starting to grow faster? We might naïvely assume that continues to look like “a wavier version” of as it does for negative . Well, let’s look at where these “waves” might be by looking at the derivative:
When is this zero?
But we know that is at largest 1 and that is always larger than 1 for positive , so this derivative will never be 0! So we know that when sketching the rest of the graph for positive , it will be monotonically increasing with no obvious “waves”.
But what about higher-order waves?
Well, now that we’ve got this far we might spot that the further derivatives of don’t get much more exciting:
And, since each of , , , and are no larger than 1, we can see that these derivatives will always be positive for positive , and so won’t have any stationary points, points of inflection, or any turns of any order for . Great!
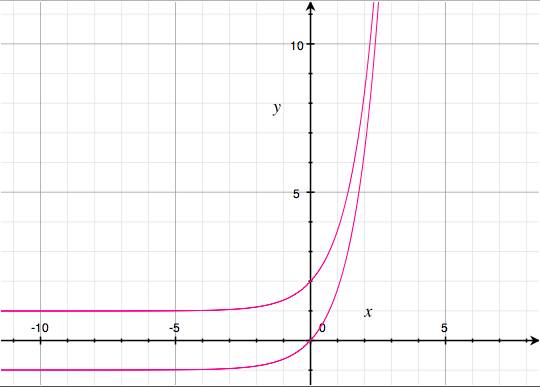
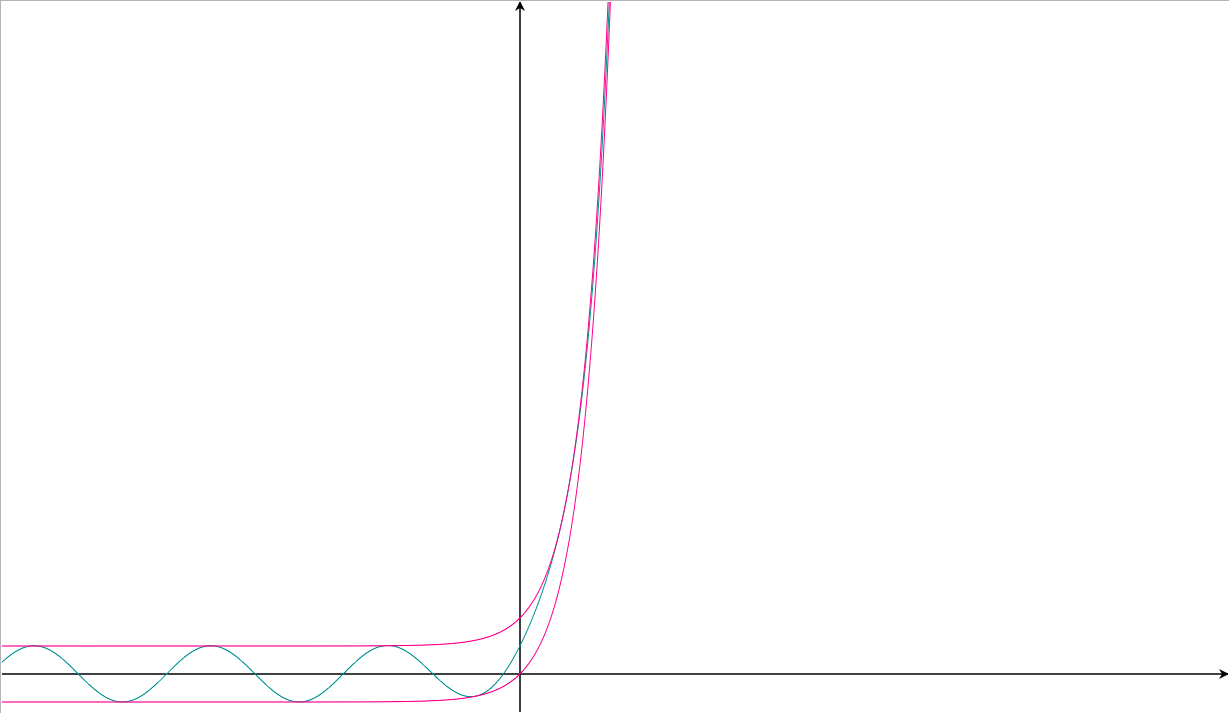
But what else do we know which might help us sketch it? Well, we know that because is bounded by -1 and 1, must exist within the envelope of and , which look like this:
They grow very fast after , right? It hardly looks surprising that doesn’t get a chance to wave around if it’s bounded in that tiny space! How does it fit within the gap, though? Well, because oscillates between its bounds of +1 and -1 regularly and infinitely often, should oscillate between its bounds of and also regularly and infinitely often. This is obvious for negative , but it’s still true for positive . will touch its bounds regularly and infinitely-many times.
So here is where I start to worry.
We’ve got a function which we’ve seen should oscillate regularly between two monotonically smooth bounds, touching them both infinitely many times; yet it itself is always increasing and never turns at any order. I don’t know about you, but these two facts just don’t sit together with me.
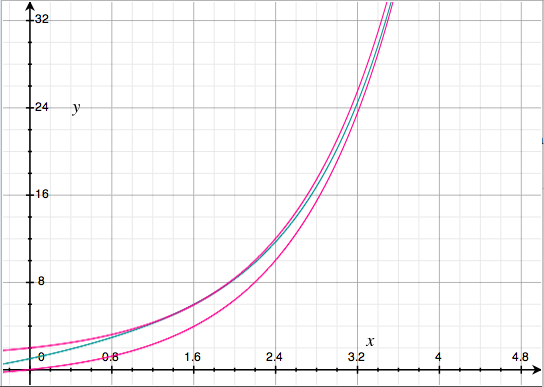
But at least we can now draw it nicely.
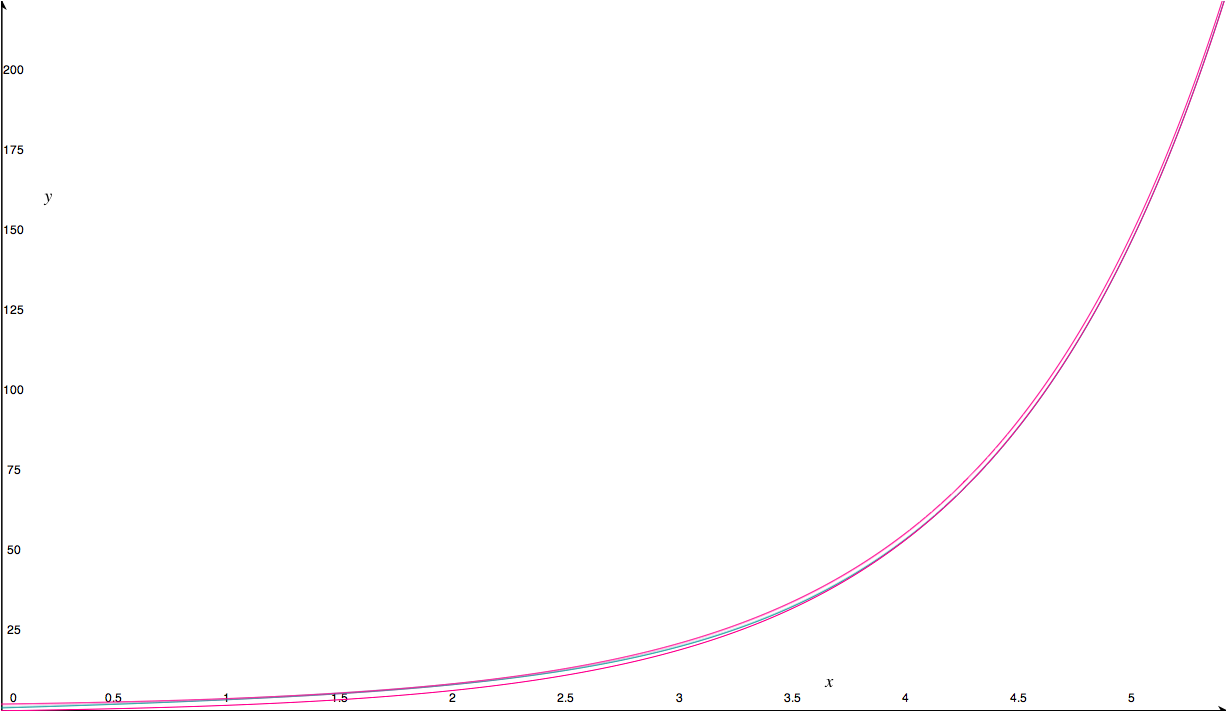
It’s hard to see, given how fast everything grows, but it does in fact oscillate between its bounds as regularly as does.
Pretty cool, huh?!
Here’s a zoomed-out version of that graph so you can see it better. One of the transition of negative to positive , one only of positive and with the aspect changed to demonstrate the oscillation as much as possible: